Open Analytics — Video Player Analytics
AI-native video player analytics powered by EPAS open standard. Query your data with Claude, Cursor, or SQL — zero vendor lock-in.
Video analytics: a $15.04B market growing 22.18% annually (Mordor Intelligence 2026)
Open Analytics is a video QoE analytics solution built on Open Source Cloud (OSC) — a managed platform for 180+ open source services with zero vendor lock-in. Deploy and manage your full analytics stack via OSC at app.osaas.io.
Get StartedFrom €199/mo · Billed from day one · Cancel anytime
Analyzing millions of player sessions across live and on-demand workflows.
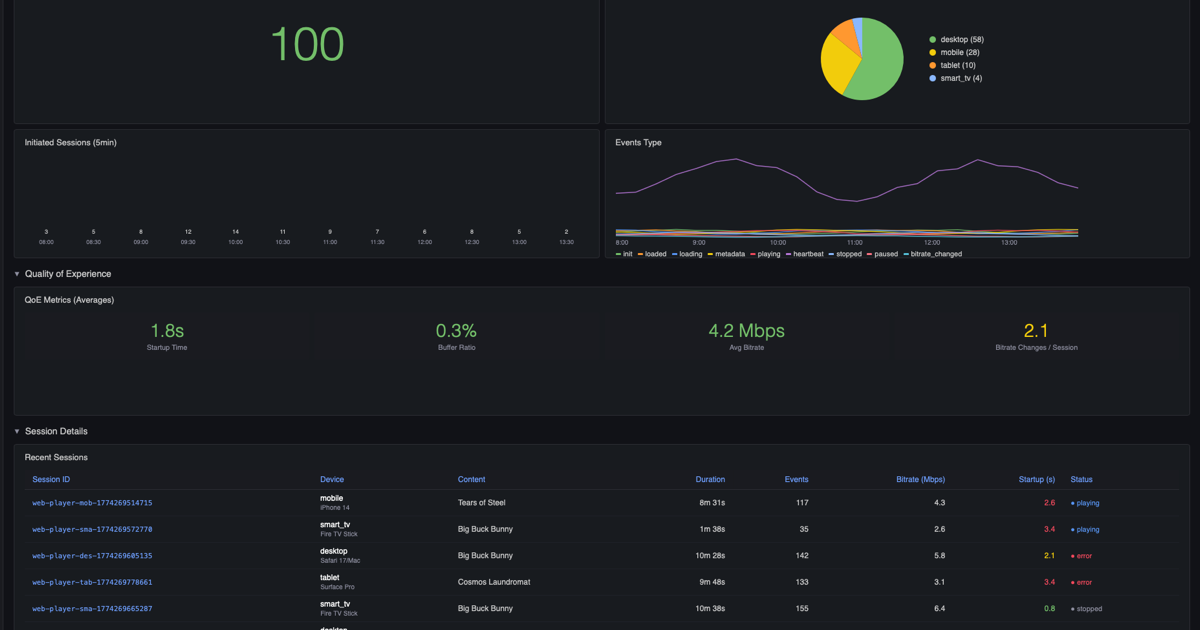
Real-time QoE monitoring dashboard
Who Uses Open Analytics
Built for video streaming teams who need real-time insight into player quality, viewer engagement, and delivery performance.
OTT Platforms
Monitor real-time QoE across 10K+ concurrent viewers. Track startup time, buffering, and errors by device and geo.
- Startup time by region & device
- Concurrent viewer QoE score
- Error rate & rebuffering ratio
Live Streaming Events
Ensure broadcast-grade reliability. Track QoS against your SLA thresholds, and build alerts on top in Grafana. Before you do, read the No-Data routing note.
- Live latency & dropped frames
- SLA threshold tracking (alertable in Grafana)
- Bitrate stability over time
Content Creators
Understand viewer behavior. Which videos have the highest completion rates? Where do viewers drop off?
- Video completion rate by title
- Drop-off points & engagement depth
- Play events & pause patterns
Video CDN Operators
Measure CDN performance. Compare bitrate delivery across regions and identify edge server issues.
- Bitrate delivery by edge region
- CDN-to-CDN performance comparison
- Edge server error correlation
Built for AI-Generated Video Apps
AI writes the code. OSC monitors the quality.
AI-generated video code behaves unpredictably — unexpected rebuffering, startup failures, error spikes from edge cases the AI didn't handle. Open Analytics gives you real-time QoE monitoring so you know exactly when and why your video pipeline breaks.
- Real-time player error detection
- Startup failure tracking
- Rebuffering and stall monitoring
- Spot when AI-generated code breaks playback
Built to Integrate
- Players
- The EPAS Web SDK attaches to any HTML5
<video>element — so it works with any player built on one, including hls.js, dash.js, Video.js, Shaka Player and native HTML5 video. Native Android (ExoPlayer, Kotlin/Java) and iOS (Swift) SDKs are published separately. - Self-hosting
- The full EPAS pipeline — Eventsink, Worker, ClickHouse, Grafana — ships as open source and can run on your own infrastructure. Each component publishes a Dockerfile; see the eventsink and worker repos.
- Data format
- Events follow the open EPAS specification.
Track What Matters Most: Startup Time & Buffering
Open Analytics tracks the critical Quality of Experience (QoE) metrics that directly impact viewer retention and revenue.
Higher playthrough rates. Viewers abandon if >2s.
Longer sessions. >3% indicates serious delivery problems.
Lower churn. Track quality shifts and playback errors.
Instant visibility. ClickHouse queries return in milliseconds.
Features
Real-time Analytics
Track playback events, errors, and user behavior in real-time with ClickHouse.
Grafana Dashboards
Visualize your analytics data with pre-built Grafana dashboards.
EPAS Standard
Built on the open Eyevinn Player Analytics Specification. No vendor lock-in. Instrument once with EPAS: if you ever want to switch analytics backends, your player code stays unchanged. One config line, not a re-instrumentation project. Export destinations: ClickHouse (included), BigQuery, Snowflake, or any SQL-compatible database.
Open Source
Full transparency. Contribute, customize, and own your analytics stack.
AI-Powered QoE Monitoring You Can Audit
Open Analytics combines AI-powered natural language querying (via Claude, Cursor, Windsurf, or any MCP-compatible client — see mcp.osaas.io) with direct SQL access to raw QoE metrics. Unlike proprietary AI monitoring tools, you can audit every decision — no black boxes, no vendor interpretation layers.
Compliant by Design
Open Analytics meets EU Data Act (September 2025) requirements from day one — no additional compliance work needed.
Data Portability
EPAS open format: export your analytics to any backend — Datadog, Splunk, or your own infrastructure — without data conversion.
Zero Lock-in
Unlimited SQL access: ClickHouse credentials included. Run custom queries and export via CSV or JSON at any time.
Interoperability
ClickHouse MCP: AI agents can migrate your data to any destination automatically — interoperability built in.
Proprietary analytics platforms (using closed formats) will require costly compliance work. Open Analytics is compliant from day one — zero migration risk for European enterprises.
Five fully managed services. One price.
Eventsink, SmoothMQ, Analytics Worker, ClickHouse, and Grafana — all provisioned, configured, and maintained automatically.
Business
Everything you need for production workflows
- Unlimited productions
- Unlimited analytics events — no per-event fees
- Priority support
- Advanced features
- Cancel anytime
Open Analytics vs per-view pricing
Flat rate. No per-view billing. No surprise invoices.
| Monthly views | Open Analytics | Typical per-view platform |
|---|---|---|
| 500K views/month | €199 | $240+ |
| 1M views/month | €199 | $499 |
| 2M views/month | €199 | $999+ |
| 10M views/month | €199 | $4,999+ |
Pricing based on publicly available rates as of September 2026. Per-view platform figures reflect Mux Data pricing: Media plan ($499/mo for 1M views, $0.50/1K overage); pay-as-you-go tier ($0.60/1K views, first 100K free). 500K-views figure uses the pay-as-you-go tier (100K free + 400K × $0.60/1K = $240).
Your data trains nothing.
Analytics are stored in your ClickHouse instance. We never access or use your data for AI training.
Self-healing infrastructure on Kubernetes.
Services run on managed Kubernetes with automatic restarts and health checks. No manual intervention required.
What's Included
Complete Analytics Stack
Everything deployed automatically
- Player Analytics Eventsink - Ingest events from players
- SmoothMQ - Message queue for reliable processing
- Analytics Worker - Process and store events
- ClickHouse - Real-time analytics database
- Grafana - Visualization dashboards
Deploy with one click. Auto-configured and ready to use.
Frequently Asked Questions
EPAS (Eyevinn Player Analytics Specification) is an open standard for video player telemetry. It defines a common format for collecting and exchanging player analytics data, ensuring your metrics are portable across different platforms and tools. Unlike proprietary formats, EPAS gives you complete control over your data with zero vendor lock-in.
Open standards eliminate vendor lock-in and ensure data portability. With EPAS, you can export your analytics data to any backend or switch providers without losing historical data or rewriting your instrumentation. Your data remains yours, in a format that's universally readable and future-proof.
Unlike proprietary platforms that lock your data in their ecosystem, Open Analytics gives you complete freedom. You get direct access to your ClickHouse database, can export data in standard formats, and aren't tied to a single vendor's visualization tools or pricing model. It's the same powerful analytics capabilities without the restrictions.
Track all essential video player metrics including play/pause events, buffering, bitrate changes, video quality, error events, and playback completion. You can also capture custom metadata like content ID, user ID, device type, and any business-specific attributes. All data is stored in real-time for immediate analysis.
Yes! Open Analytics provides SDKs for Web (JavaScript), Android (Kotlin/Java), and iOS (Swift) that integrate with any video player. The SDKs handle event collection and transmission automatically, so you can instrument your player with just a few lines of code regardless of your player technology.
Absolutely not. You have full export capabilities and direct access to your ClickHouse database. Your data is stored in the open EPAS format, making it completely portable. You can export to CSV, integrate with other tools via SQL, or migrate to another platform without any data conversion required.
The Business plan includes unlimited productions, unlimited analytics events with no per-event fees, 5 fully managed services (Eventsink, SmoothMQ, Analytics Worker, ClickHouse, and Grafana), priority support, and advanced features. Everything is auto-configured and deployed with one click. EUR 199/month, billed from day one. Cancel anytime.
No installation or management required. Open Analytics is a fully managed deployment—we handle provisioning, configuration, updates, backups, and scaling automatically. You get production-ready analytics infrastructure without DevOps overhead, letting you focus on insights instead of infrastructure.
Yes. Open Analytics meets EU Data Act (September 2025) requirements from day one — no additional compliance work needed. The EPAS open format ensures data portability (export to any backend), direct ClickHouse SQL access eliminates lock-in (custom queries, CSV/JSON exports anytime), and ClickHouse MCP enables interoperability (AI agents can migrate data to any destination automatically). Proprietary platforms using closed formats will need costly compliance work; Open Analytics is compliant from day one.
Your Analytics Pipelines
Create New Pipeline
Need help integrating? Check the documentation for SDK setup.
SQL Access
Every Open Analytics pipeline includes direct SQL access to your ClickHouse database. Query your raw event data, build custom reports, and connect BI tools — all without vendor lock-in.
Connection Credentials
Per PipelineSelect a pipeline to view its ClickHouse connection details.
Schema Reference
player_eventsTable: player_events
All player events are stored in the
player_events table in the
analytics database.
CREATE TABLE analytics.player_events (
  -- Identity
  sessionId        String,       -- Unique session ID per viewer
  correlationId    String,       -- Correlates events in same session

  -- Event metadata
  event_type       String,       -- 'play', 'pause', 'buffering', 'bitrate_changed',
                                 --  'error', 'heartbeat', 'stop', 'seek'
  timestamp        DateTime,     -- Event timestamp (UTC)

  -- Playback state
  playhead         Float64,      -- Playback position in seconds
  duration         Float64,      -- Content duration in seconds
  startup_time_ms  Int64,        -- Time to first frame (ms), set on 'play'
  bitrate          Int64,        -- Current bitrate (bps)
  resolution       String,       -- e.g. '1920x1080'

  -- Buffering
  rebuffering_duration_ms Int64, -- Duration of this buffering event (ms)
  playback_duration_ms    Int64, -- Total playback time in session so far (ms)

  -- Content & player metadata
  content_id       String,       -- Your content identifier
  content_url      String,       -- Stream URL
  user_id          String,       -- Viewer identifier (optional)
  device_type      String,       -- 'web', 'android', 'ios', 'ctv'
  cdn              String,       -- CDN identifier (optional)
  player_type      String,       -- Player technology

  -- Error info
  error_code       String,       -- Error code on 'error' events
  error_message    String        -- Human-readable error description
) ENGINE = MergeTree()
ORDER BY (sessionId, timestamp);
Example Queries
ClickHouse SQLAverage Startup Time by Device Type
Identify which devices have the slowest time-to-first-frame. Target: under 2 seconds.
SELECT
  device_type,
  AVG(startup_time_ms)          AS avg_startup_ms,
  ROUND(AVG(startup_time_ms) / 1000, 2) AS avg_startup_s,
  COUNT(DISTINCT sessionId)     AS sessions
FROM analytics.player_events
WHERE event_type = 'play'
  AND timestamp > NOW() - INTERVAL 7 DAY
GROUP BY device_type
ORDER BY avg_startup_ms DESC;
Rebuffering Ratio by CDN
Compare delivery quality across CDNs. Target: under 1%.
SELECT
  cdn,
  ROUND(
    (SUM(rebuffering_duration_ms) / NULLIF(SUM(playback_duration_ms), 0)) * 100,
    2
  ) AS rebuffering_ratio_pct,
  COUNT(DISTINCT sessionId) AS sessions
FROM analytics.player_events
WHERE playback_duration_ms > 0
  AND timestamp > NOW() - INTERVAL 7 DAY
GROUP BY cdn
ORDER BY rebuffering_ratio_pct DESC;
Error Rate by Content
Find which content items trigger the most playback errors.
SELECT
  content_id,
  COUNT(*)                                AS total_errors,
  COUNT(DISTINCT sessionId)               AS affected_sessions,
  topK(5)(error_code)                     AS top_error_codes
FROM analytics.player_events
WHERE event_type = 'error'
  AND timestamp > NOW() - INTERVAL 7 DAY
GROUP BY content_id
ORDER BY total_errors DESC
LIMIT 20;
Concurrent Viewers (Last Hour)
Approximate concurrent viewer count over the past hour in 5-minute buckets.
SELECT
  toStartOfFiveMinute(timestamp) AS bucket,
  COUNT(DISTINCT sessionId)       AS concurrent_viewers
FROM analytics.player_events
WHERE event_type IN ('heartbeat', 'play')
  AND timestamp > NOW() - INTERVAL 1 HOUR
GROUP BY bucket
ORDER BY bucket ASC;
Bitrate Distribution
Understand what quality levels your viewers are experiencing.
SELECT
  ROUND(bitrate / 1000000, 1) AS bitrate_mbps,
  COUNT(*)                     AS event_count,
  COUNT(DISTINCT sessionId)    AS sessions
FROM analytics.player_events
WHERE event_type = 'bitrate_changed'
  AND bitrate > 0
  AND timestamp > NOW() - INTERVAL 7 DAY
GROUP BY bitrate_mbps
ORDER BY bitrate_mbps ASC;
Export & BI Tools
IntegrationsExport to CSV (HTTP API)
Use the ClickHouse HTTP interface to download query results directly as CSV:
curl "https://{host}:8123/?database=analytics&user={username}&password={password}" \
  --data "SELECT * FROM player_events WHERE timestamp > NOW() - INTERVAL 1 DAY FORMAT CSV" \
  -o events.csv
Connect BI Tools
ClickHouse supports JDBC and ODBC drivers for connecting BI tools:
AI-Native Analytics Access
Unique DifferentiatorConnect AI Assistants to Your Analytics Database
Open Analytics is built on ClickHouse, the open-source analytics database that raised $400M at a $15B valuation in 2026, chosen for real-time analytics at any scale.
Open Analytics includes ClickHouse MCP (Model Context Protocol) support — AI assistants like Claude, Cursor, and GitHub Copilot can query your analytics database directly using natural language. No dashboards required. Just ask.
Your player analytics are already queryable by AI agents — no MCP server to configure, no data warehouse to connect. Claude, Cursor, or GitHub Copilot can query session data, rebuffering events, and startup times directly via the pre-configured ClickHouse MCP.
What You Can Do
Setup: Local MCP Client (Claude Desktop / Cursor)
Add this to your Claude Desktop or Cursor MCP configuration. Replace the placeholders with your pipeline's connection credentials from the section above.
{
  "mcpServers": {
    "clickhouse": {
      "command": "uv",
      "args": ["run", "--with", "mcp-clickhouse", "--python", "3.10", "mcp-clickhouse"],
      "env": {
        "CLICKHOUSE_HOST":     "{host}",
        "CLICKHOUSE_PORT":     "8123",
        "CLICKHOUSE_USER":     "{username}",
        "CLICKHOUSE_PASSWORD": "{password}",
        "CLICKHOUSE_DATABASE": "analytics",
        "CLICKHOUSE_SECURE":   "true"
      }
    }
  }
}
Setup: Remote MCP — No Local Installation Required
ClickHouse Cloud Remote MCP Server is now available with OAuth authentication — no local setup, no config files. Connect your AI tools directly. Ideal for agentic workflows and team environments without managing a local process.
SDK Documentation
Integrate video player analytics into your applications with our official SDKs. Built on the Eyevinn Player Analytics Specification (EPAS) for standardized, vendor-neutral event tracking.
Getting Started
All Open Analytics SDKs follow the same pattern: initialize with your Eventsink URL, attach to your player, and analytics data flows automatically to your dashboard.
- Automatic event tracking for play, pause, seek, buffering, and errors
- Periodic heartbeat events for engagement metrics
- Bitrate and quality change monitoring
- Custom metadata support for content identification
Configuring SLA Alerts in Grafana
Alerting Pitfall
When you build a Grafana-managed alert rule against your Open
Analytics metrics, note that its
DatasourceNoData and
DatasourceError cases evaluate as
independent alert instances with their own labels.
Silences, mute timings, and notification policies applied to
the primary rule may not apply to them. To be notified when
the pipeline goes quiet — not just when a threshold
breaches — configure routing for the No-Data / Error
instances explicitly.
See Grafana’s create Grafana-managed alert rule and alert rule state and health docs.
Installation
npm install @eyevinn/player-analytics-client-sdk-webQuick Start
The PlayerAnalyticsConnector automatically captures events from your HTML5 video element:
import { PlayerAnalyticsConnector } from "@eyevinn/player-analytics-client-sdk-web";

const analytics = new PlayerAnalyticsConnector("YOUR_EVENTSINK_URL");

await analytics.init({
  sessionId: crypto.randomUUID(),
  heartbeatInterval: 30000
});

const videoElement = document.querySelector("video");
analytics.load(videoElement);

// When playback ends
analytics.reportStop();
analytics.destroy();
Features
Installation
Add JitPack repository and dependency:
// settings.gradle
maven { url 'https://jitpack.io' }

// build.gradle
implementation("com.github.Eyevinn:player-analytics-client-sdk-android:1.0.0")
Quick Start with ExoPlayer
val tracker = VideoAnalyticsTracker.Builder(context, exoPlayer)
    .setEventSinkUrl("YOUR_EVENTSINK_URL")
    .setContentTitle("Video Title")
    .setHeartbeatInterval(30_000L)
    .build()

tracker.startTracking()
exoPlayer.play()

// In onDestroy()
tracker.stopTracking("user_exit")
tracker.release()
Features
Installation (Swift Package Manager)
File → Swift Packages → Add Package Dependency...
https://github.com/Eyevinn/player-analytics-client-sdk-swiftQuick Start with AVPlayer
import VideoStreamTracker

class VideoPlayerViewController: UIViewController {
    var player: AVPlayer!
    var logger: AVPlayerEventLogger!

    override func viewDidLoad() {
        super.viewDidLoad()
        player = AVPlayer(url: videoURL)
        logger = AVPlayerEventLogger(
            player: player,
            eventSinkUrl: URL(string: "YOUR_EVENTSINK_URL")!
        )
    }
}